Dashboard
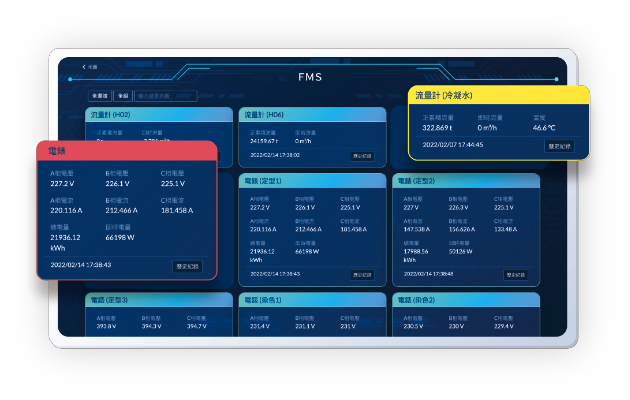
The monitoring wall displays the real-time information of each sensor. If there is an abnormal value, it will be displayed in red font, which can easily identify the difference and quickly see the value change.


History
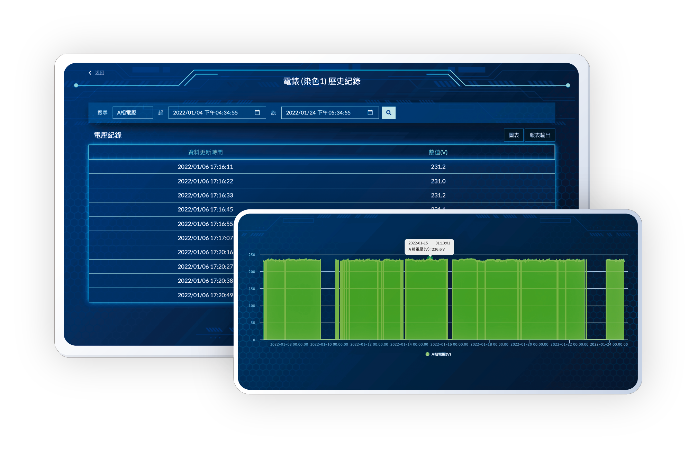
It can search for the historical value of the sensor in any time period, and use the intuitive chart to draw and present it, and export all historical data for secondary processing.
Equipment process parameter management
It can search for the historical value of the sensor in any time period, and use the intuitive chart to draw and present it, and export all historical data for secondary processing.

FMS APP
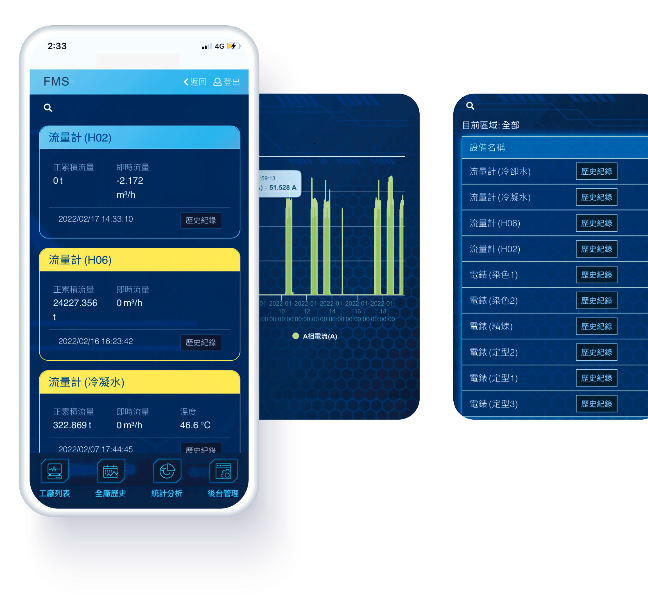
Through the App in the mobile device, you can see various electronic forms, machine operation monitoring, etc. anytime, anywhere, and you can see the operation status of the entire plant at a glance.


Notification
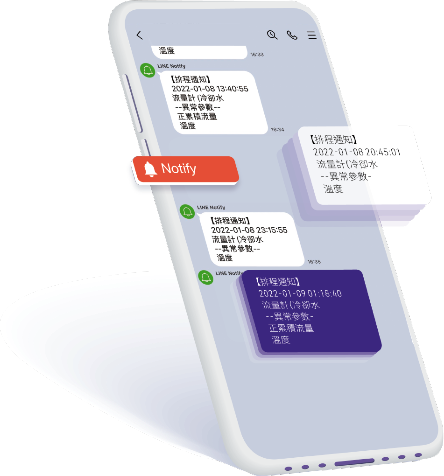
When the value exceeds the upper and lower limits, a message will be sent immediately to notify.


